I've been crunching numbers again, folks, and here's what happened in June 2014 in the Wilmington area real estate market. If you are planning on buying or selling a home, this is information you need!
First of all, there's really
excellent news for home buyers! Mortgage rates are lower now than they were at this time last year! This has come as a surprise to most lenders, who had predicted a steady rise. (They are still saying it will soon start rising, of course.) But for now, Freddie Mac's latest Primary Mortgage Market Survey says rates on 30-year fixed-rate is 4.12 percent with an average point of .05. Last June, rates were 4.29 percent.
The
good news for Sellers -- at least in New Hanover County: The average price of sold homes in New Hanover continued a steady rise in prices -- March $247K, April $255, May $277K and June $285k. News is not so cheery in Pender and Brunswick counties (unless you're a buyer!), where average prices have stayed static or fallen slightly. I believe one reason prices are rising faster in New Hanover is that the inventory is tighter, especially in the under $250k price range. Market forces being what they are, less supply to meet demand means higher prices. (see details about the Monthly Inventory Supply below.) Thanks to a stronger stock market, sales in the New Hanover high-end homes and vacation properties has also pushed up the price averages.
Comparing
traditional home sales (excluding the foreclosures and short sales), more homes were sold this year in June over last year at this time by 10%. I also like to look at what's happening with foreclosures and short sales -- and it's clear the trend toward a normalizing real estate market is continuing: Foreclosures in June 2014 are down almost 33% compared to June 2013, and short sales are down 45%.
Number of homes sold in the greater Wilmington area dropped a little between May and June, by 3.6% (Historically, sold homes almost always take a dip in June -- not sure why! maybe because kids are just out of school and families take vacation?) As would be expected with these June sales figures, the "pending sales" (sales under contract but which would typically be expected to close within 60 days) were down significantly in May. The good news is that pending sales in June were on a definite upswing (in May, 385; in June 423), which points to stronger sales in July.
Finally, let's take a look at the "Months Supply of Inventory" (MSI) in the greater Wilmington area. As of June, the MSI was 6.96. What does that mean? The MSI is an estimate of how long it will take for all the market's homes to be sold (or absorbed) based on how many homes are currently on the market and the rate homes have sold in the past (absorption rate).
MSI is simply used to compare the size of an inventory to the rate of sale. This is a great indicator of how balanced a market is. Conventional wisdom says a balanced market has a monthly inventory of 5-7 months. Less than 5 months supply means more competition among buyers, and is a seller's market; more than 7 months means an abundance of homes to choose from, and is a buyer's market.
MSI of 6.9 looks pretty balanced, although just on the cusp of being a Buyer's Market. However, to get a better picture of the local market, it helps to break down the inventory by price range. That tells us, across the greater Wilmington area, homes under $150K have an MSI of 5.4. And, also looking at specific locales, in New Hanover County, homes in this price range have an MSI of 3.9 months; for homes between $150k and $250k, the MSI is 4.2! That's well into Seller's Market territory. It's tougher for home buyers in this price range to find a home, and may be more difficult to negotiate the price. On the other end of the spectrum, the MSI for higher-end homes is still firmly in the Buyer's Market range, although the MSI has been dropping dramatically. More high-end homes are selling, and they are selling faster than in previous months.
Here's a breakdown of MSI stats. (note: The most recent data is from May figures since I don't have all the MSI data for June yet.)
Apr May (May/New Hanover)
Under 150K 5.1 5.4 3.9
150k-250k 6.9 5.5 4.2
250k-350k 6.9 6.3 5.6
350k-450k 12.8 9.7 8.6
450k-550k 21.8 10.8 6.9
550k-1M 22.2 17.4 11.9
Hope you found this helpful.

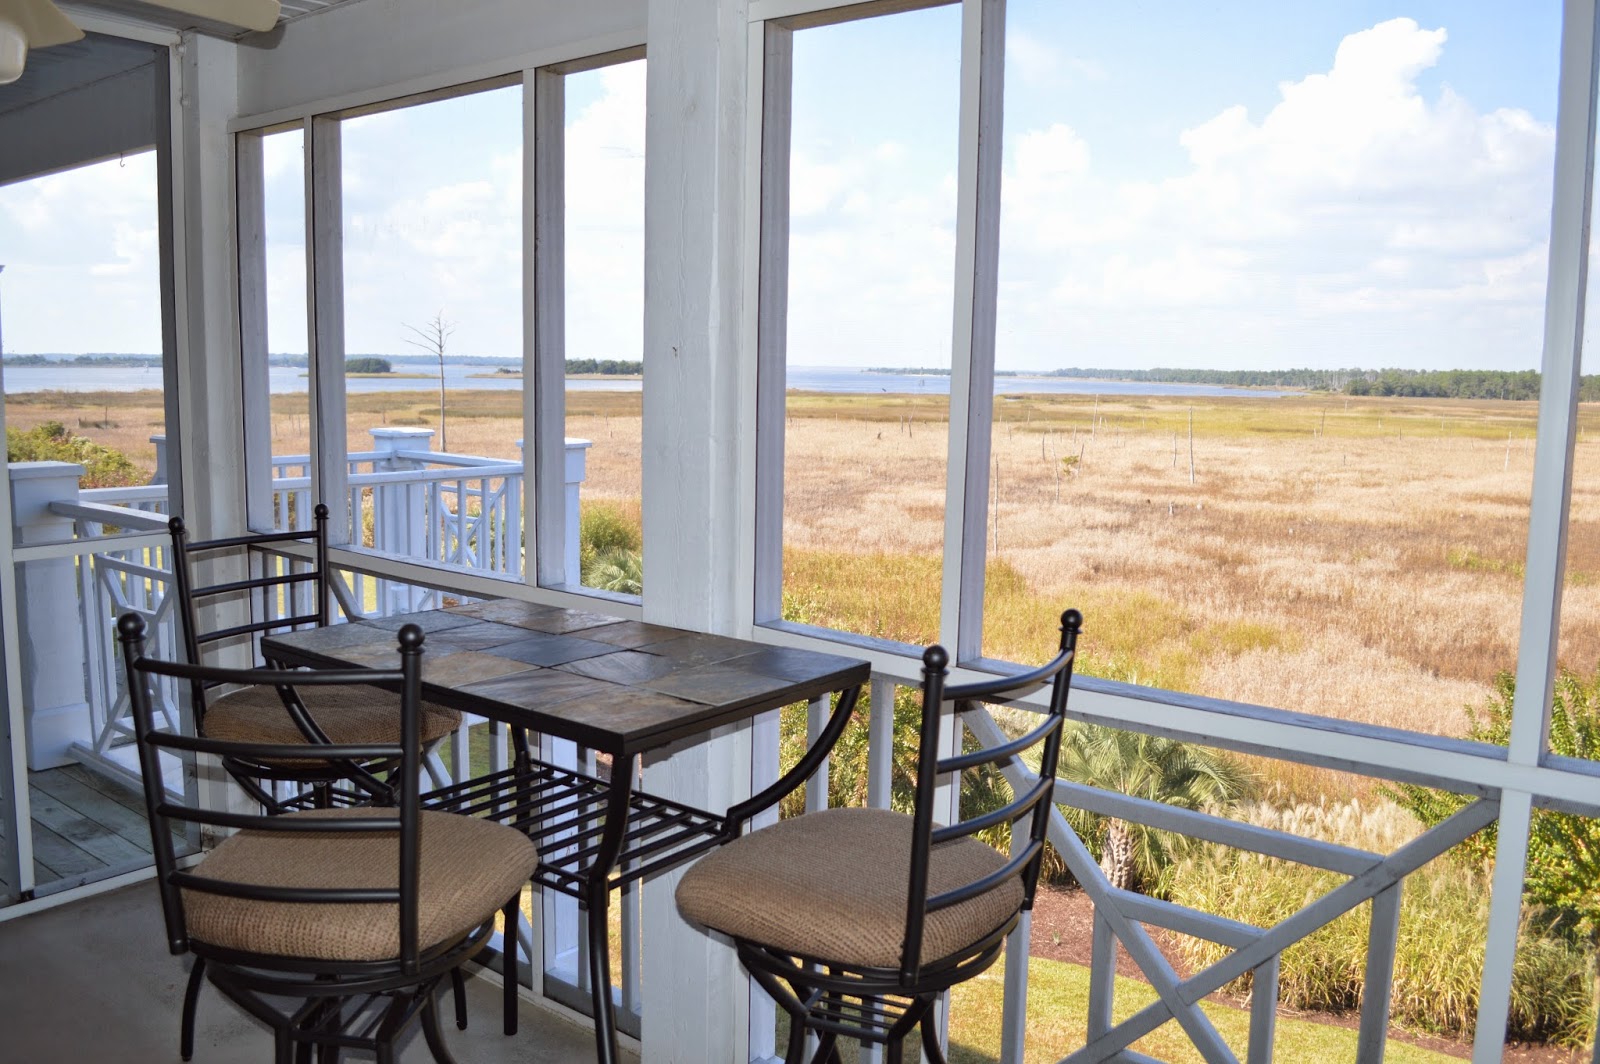
 It's been awhile since I did an open house. That's because my days (and nights) have been chock-a-block full showing homes and writing up contracts lately! (Yeah! That's the kind of busy I love!) But I've missed doing open houses. Some agents are about as fond of open houses as a trip to the dentist, but I think they're fun and a great way to meet new clients, as well as help the seller, of course. (Some day soon I'll write a blog about the good, the bad, and the ugly of open houses.) So, this weekend I'm thrilled to be able to host an open house at the gorgeous Turtle Cay condos. These homes are just south of Wilmington NC, off of River Road, and have views to die for across the marshes to the Cape Fear River. I could sit on this condo's balcony for hours and watch the birdlife and passing river traffic. I expect, however, I'll be too busy with visitors to the open house to spend much time gazing through my binoculars this Sunday -- but I promise to let you borrow them if you come join us Sunday! Here's my ad for the Open House: